The Drought Severity and Coverage Index is an experimental method for converting drought levels from the U.S. Drought Monitor map to a single value for an area. DSCI values are part of the U.S. Drought Monitor data tables. Possible values of the DSCI are from 0 to 500. Zero means that none of the area is abnormally dry or in drought, and 500 means that all of the area is in D4, exceptional drought.
Download Fact Sheet
Computing the DSCI
You can compute it two different ways:
Using cumulative Drought Monitor data, add the percentages for D0 through D4 for a given week to get the Drought Severity and Coverage Index for that week.
Example of computing DSCI using cumulative USDM statistics
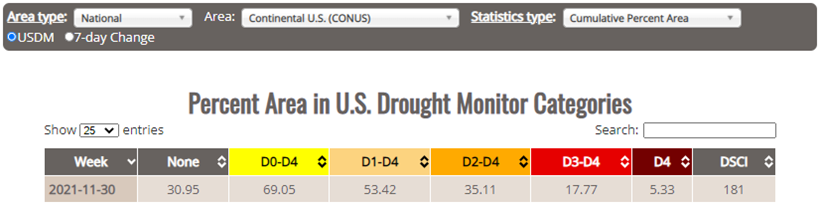
69.05 + 53.42 + 35.11 + 17.77 + 5.33 = 181
Or, to see more math, use categorical (not cumulative) Drought Monitor data, and compute a weighted sum of the percentages in D0 through D4:
1(D0) + 2(D1) + 3(D2) + 4(D3) + 5(D4) = DSCI
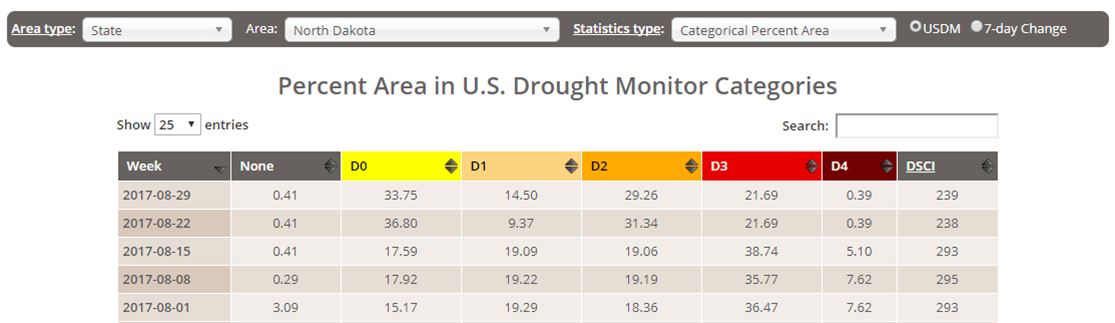
Example of computing DSCI using categorical USDM statistics
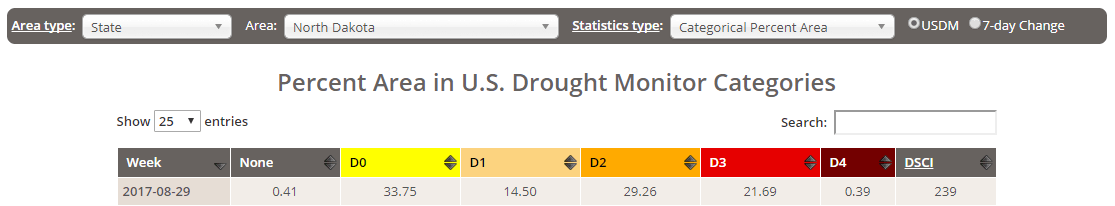
1(33.75) + 2(14.50) + 3(29.26) + 4(21.69) + 5(.39) = 33.75 + 29 + 87.78 + 86.76 + 1.95 = 239
The utility of the DSCI has not yet been widely tested but it provides a convenient way to convert USDM data from categorical to continuous, and to aggregate from spatially specific to geopolitical boundaries.
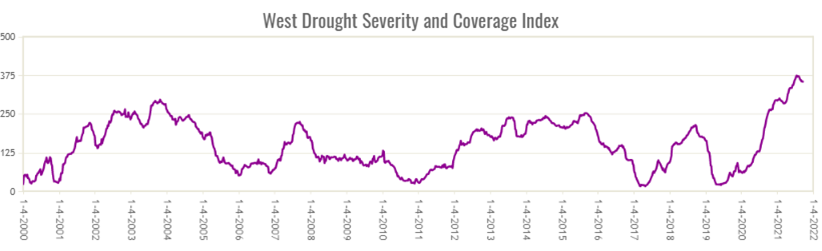
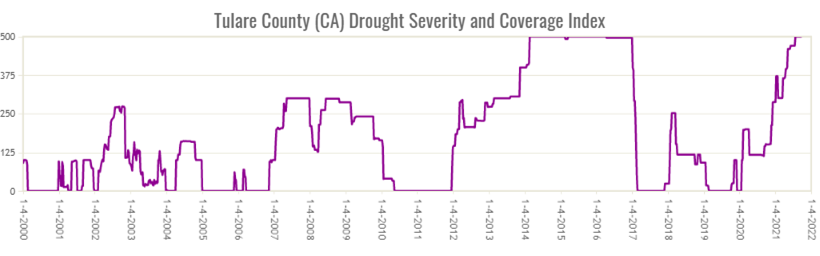
What it looks like over time
Note that because drought has a large footprint, smaller areas have more all (500) and none (0) DSCI values. It doesn’t necessarily mean that drought is more extreme there. It actually means that a more locally specific description is possible when computing statistics for a smaller area. For example, the Western U.S. is a very large region, and as of 2021, the lowest DSCI for the West in more than 20 years of USDM data was 16, in 2017, when just under 3% of the area was in moderate drought or worse. Its highest DSCI was 374, in July 2021, when 95% of the region was in some degree of drought and 28% was in exceptional drought. In contrast, Tulare County, California, which is part of the western region, has had many weeks with DSCI of zero, and many weeks with DSCI of 500.
Aggregation over time
Q: How can I summarize the U.S. Drought Monitor over time, with one number?
A: Best practices for using DSCI over time are still evolving and depend on the intended use. The most obvious choices are to average or sum it.
Averaging DSCI: The advantage of averaging the DSCI is that the same 0-500 scale applies, so users would not have to learn a new scale, and less qualifying detail is needed for context. For example, a state climatologist might find it useful to compare the average DSCI for their state from month to month as part of a regular report.
Summing DSCI: Summing the DSCI may be more useful for comparing different droughts. If for example two areas experienced droughts of comparable duration, but one had a higher total DSCI than the other, we could conclude that the one with the higher DSCI experienced a more intense or more widespread drought. Summing the DSCI could also be useful for comparing two droughts from the same area.
Example of summing for five weeks
239 + 238 + 293 + 295 + 293 = 1358
Credit
The idea for the Drought Severity and Coverage Index is courtesy of Adnan Akyuz, North Dakota State University. Suggested citation:
Akyuz, F. A. 2017. Drought Severity and Coverage Index. United States Drought Monitor. https://droughtmonitor.unl.edu/About/AbouttheData/DSCI.aspx