A U.S. Drought Monitor Q&A
Who draws the map?
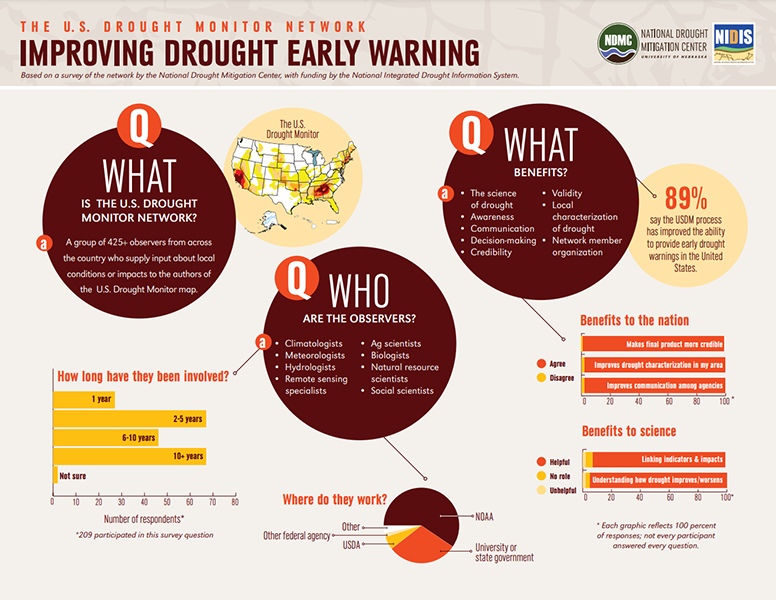
The U.S. Drought Monitor has been a team effort since its inception in 1999, produced jointly by the National Drought Mitigation Center at the University of Nebraska-Lincoln, the National Oceanic and Atmospheric Administration and the U.S. Department of Agriculture. Meteorologists and climatologists from the NDMC, NOAA and USDA take turns as the lead author of the map, usually two weeks a time. The author’s job is to do something that a computer can’t. When the data is pointing in different directions, they make sense out of it.
How do we know when we're in a drought?
When you think about drought, you probably think about water—or the lack of it. Precipitation plays a major role in the creation of the Drought Monitor, but the map’s authors consider many data sources. Some of the numeric inputs include precipitation, streamflow, reservoir levels, temperature and evaporative demand, soil moisture and vegetation health. No single piece of evidence tells the full story, and neither do strictly physical indicators. That’s why the USDM isn’t a statistical model; it’s a blend of these physical indicators with drought impacts, field observations and local insight from a network of more than 450 experts. Using many different types of data and reconciling them with expert interpretation is what makes the USDM unique. We call it a convergence of evidence approach.
Learn more about the USDM process at the Drought Classification page.
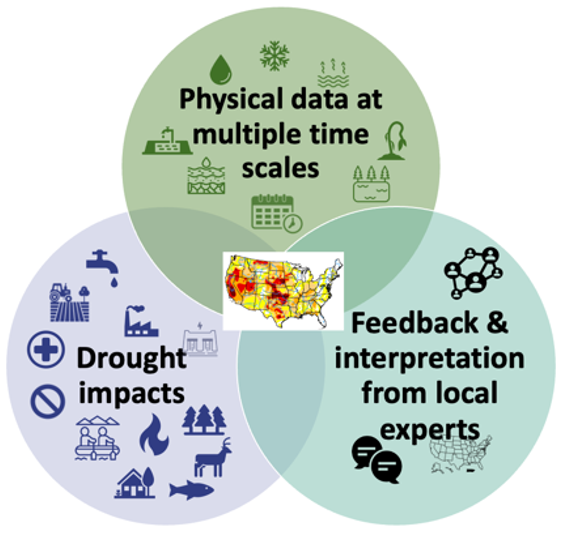 The USDM uses a convergence of evidence approach, bringing together physical climate, weather and hydrological data with records of drought impacts, on-the-ground observations and local expert feedback.
How fast does the map change?
Recognizing emerging drought, or determining when a drought is over, entails understanding what’s normal for a given location and season and observing both short- and long-term weather patterns. If an area has been in drought for a while, it usually takes more than one or two rains to end it. Intense heat can also make things dry out quickly, but, as an established practice, the map doesn’t show drought intensification by more than one category per week (though, in the event of a major storm, it can improve more quickly).
Does the USDM look back or forward in time?
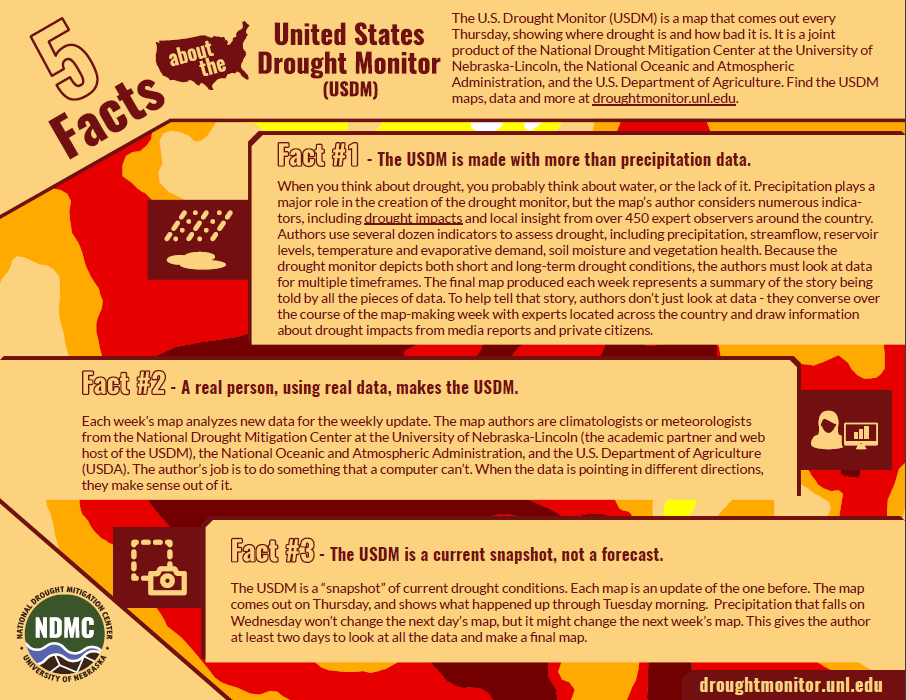
Unlike most of the weather maps people regularly see, the U.S. Drought Monitor is not a forecast; it looks back in time, providing a “snapshot” of very recent conditions. The map comes out on Thursdays, using data through the previous Tuesday morning and building upon the previous week’s map. That gives authors about two working days to review the latest data. It also means that any precipitation that falls on Wednesday will not be incorporated until the following week. Once a weekly USDM map is finalized and published, there will not be any changes considered or made retroactively.
Who uses it, and what do they do with it?
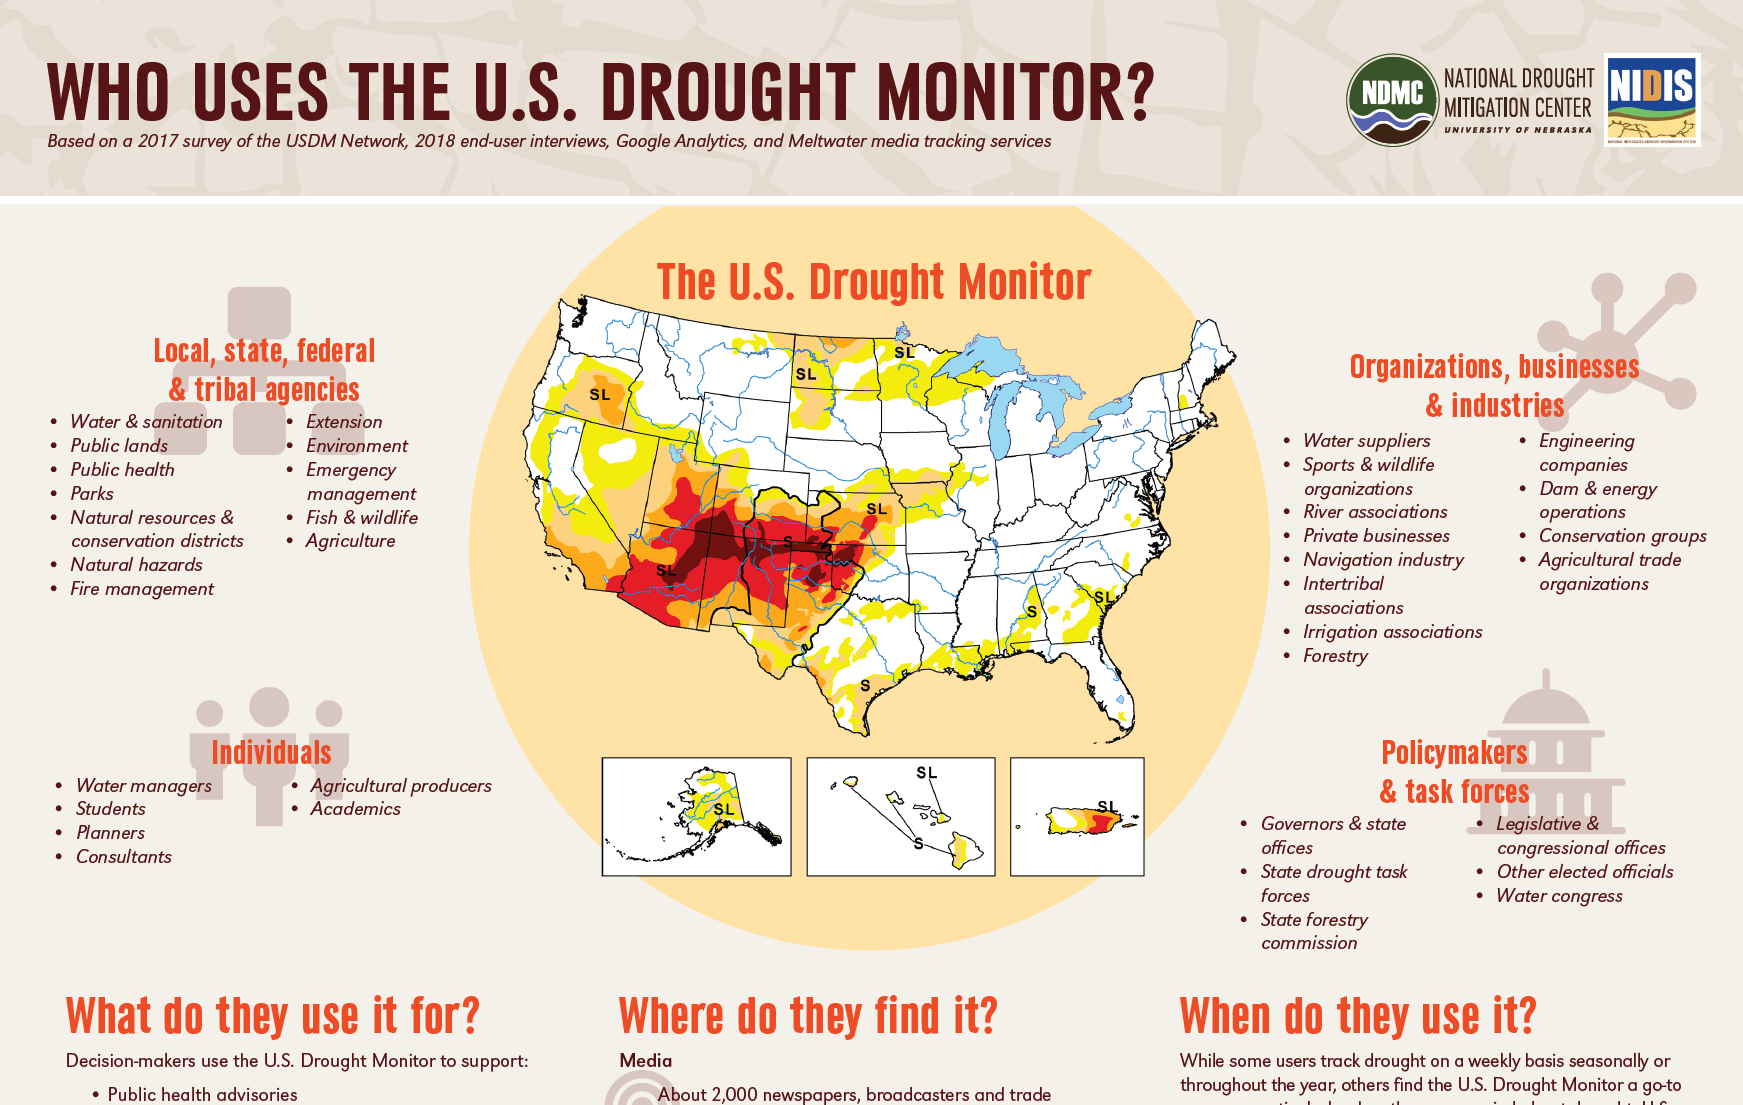
The USDA uses the Drought Monitor to trigger disaster declarations and eligibility for low-interest loans. The Farm Service Agency uses it to help determine eligibility for their Livestock Forage Disaster Program, and the Internal Revenue Service uses it for tax deferral on forced livestock sales due to drought. State, local, tribal and basin-level decision makers use it to trigger drought responses or declare drought emergencies, ideally along with other local indicators of drought. Though these various entities use the USDM, it does not in itself trigger any political actions.
How does drought affect the country?
Drought is a normal part of the climate. It tends to be a slow-moving hazard, which can cause people to underestimate the damage it can do, but losses from drought may be as substantial as those from hurricanes, tornadoes and other disasters. Drought causes losses to agriculture; affects domestic water supply, energy production, public health and wildlife; and contributes to wildfire, to name a few of its effects. However, it is important to note that large urban water systems generally have diverse water supplies and can keep water flowing in both dry and wet periods.
Learn more about the impacts of drought with the Drought Impacts Toolkit. You can also see how drought affects different industries and states with the State Impacts tool.
How can I get involved?
Want to contribute your observations to the USDM process? Here are some ways.
- Talk to your state climatologist — Find the current list at the American Association of State Climatologists website at www.stateclimate.org.
- Submit CMOR reports — Use the Condition Monitoring Observer Report system to provide information about how drought is affecting your area. Your report will appear immediately on an interactive map. Reports won’t directly change an area’s classification on the USDM, but your observation will help Drought Monitor authors and others interpret complex data and identify areas that may need more attention.
- Become a CoCoRaHS observer – Submit drought reports along with daily precipitation observations. Learn more at www.cocorahs.org.
- Email — Emails sent to droughtmonitor@unl.edu inform the USDM authors.
Access a suite of factsheets on the USDM and other drought monitoring tools on the NDMC website.