The USDM differentiates between short- and long-term drought. Short-term drought can have impacts on agriculture and grasslands, and the drought classification can rapidly change. Long-term drought, in contrast, has deeper impacts on hydrology and ecology and can persist even with short-term gains in precipitation.
- S = Short-term, typically less than 6 months (agriculture, grasslands)
- L = Long-term, typically more than 6 months (hydrology, ecology)
- SL = Area contains both short- and long-term impacts
Each week, we also provide data on the Drought Severity and Coverage Index. The DSCI is a convenient, experimental method for converting categorical USDM data into a single continuous variable for each area of interest.
You can learn more about drought classification and the USDM process through our tutorials.
It’s not just rain and snow
To determine drought intensity, USDM authors use a convergence of evidence approach, blending objective physical indicators with insight from local experts, condition observations and reports of drought impacts. It is this combination of the best available data, local observations and experts’ judgment that make the U.S. Drought Monitor more versatile than other drought measures. Learn more with our convergence of evidence tutorial.
In terms of physical indicators, the USDM relies on several numeric inputs. Short-term drought measures focus on precipitation on the scale of 1-3 months. Long-term blends, in contrast, focus on 6-60 months. But authors rely on several climate, weather and hydrology inputs across different time spans, shown broadly in the graphic below.
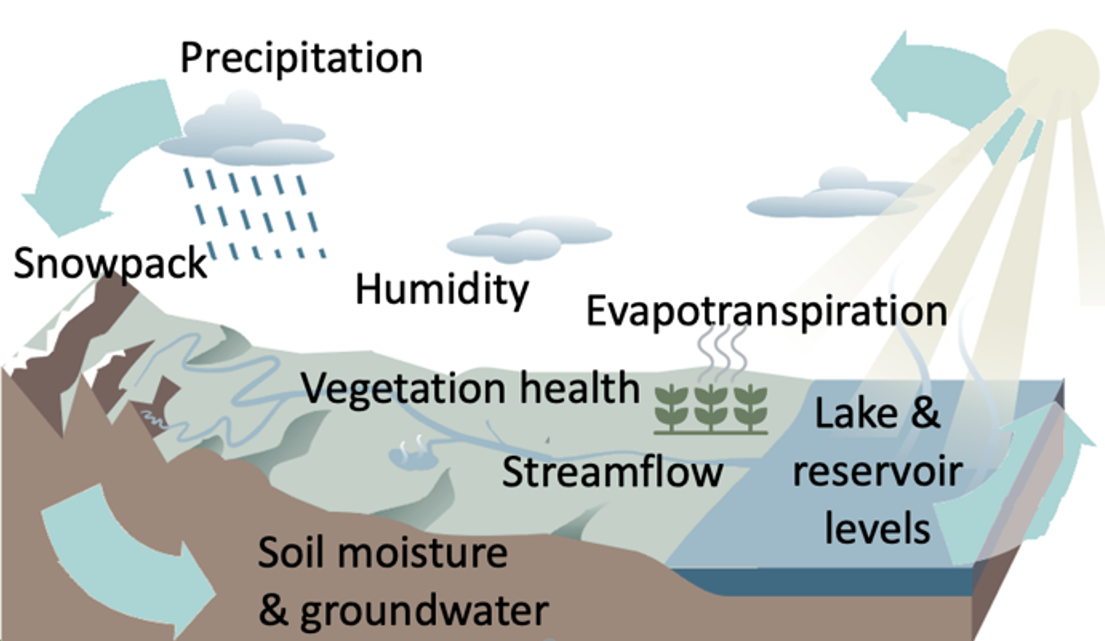 The USDM incorporates several types of physical data, at all different time scales, beyond just rain and snow.
To access some of the specific data sources, visit the Current Conditions and Outlooks page.
Because the Drought Monitor depicts both short- and long-term drought conditions, the authors must look at data over different time intervals. Part of the challenge is balancing short-term rainfall with long-term dryness and vice versa.
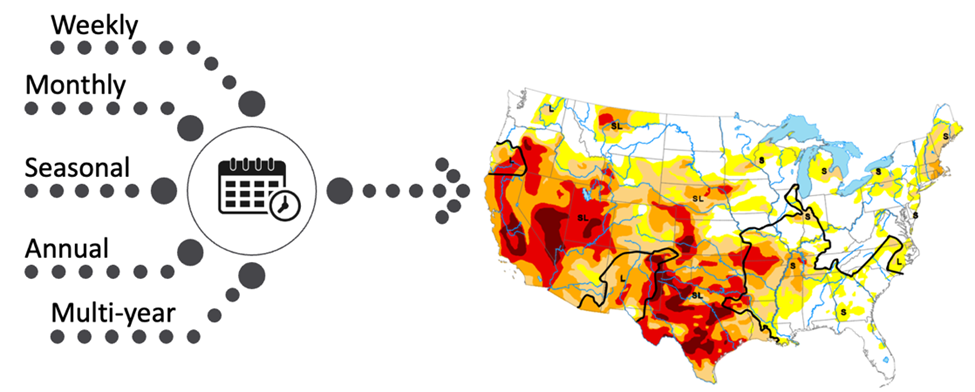 The USDM incorporates data at various time scales to depict both short- and long-term drought conditions.
The map is made by people, not computers
The USDM map provides a “snapshot” of current conditions. Authors build upon the previous week’s map, identifying areas that might have changed in response to recent weather patterns. They bring together the physical climate, weather and hydrology data and reconcile that with local expert feedback, impact reports and conditions observations. The author is also responsible for weighing different indicators based on what’s most appropriate for a particular place and time of year. In the West, for example, winter snowpack has a stronger bearing on water supplies than in the East.
When the data points in different directions, they make sense out of it. Authors come from the National Drought Mitigation Center at the University of Nebraska-Lincoln, the United States Department of Agriculture, the National Oceanic and Atmospheric Administration and the National Aeronautics and Space Administration, trading off responsibility every couple of weeks.
Learn more about the USDM Development Process
Caveats on Using the U.S. Drought Monitor
The USDM provides a consistent big picture look at drought conditions in the U.S. and its territories. Although it’s based on many types of data, including observations from local experts across the country, we don’t recommend using it to infer specifics about local conditions. It can certainly be used to infer potential drought effects, including water shortage. However, it is important to note that large urban water systems generally have diverse water supplies and can keep water flowing in both dry and wet periods. The State Impacts Tool provides a database of past drought impacts based on season, drought severity, state and industry. But the USDM is not intended to replace drought mitigation guidance from local water systems and governments.
Reports submitted to the Condition Monitoring Observer Systems are a valuable piece of supporting evidence used in the development of the USDM. They provide on-the-ground information to help authors better understand local conditions and identify areas that might need more attention. However, reports to CMOR—or other crowdsourced or citizen science observations—are not used as sole justification to change an area’s drought classification.